If you follow any stats blog, you have probably heard of Reinhart and Rogoff's paper “Growth in a Time of Debt” by now. If you missed it, it's a paper arguing that public sector debt levels over 90% are associated with much lower growth. It was published three years ago but it has been much talked about since Thomas Herndon, Michael Ash and Robert Pollin released another paper showing that the association is much weaker than suggested in the original publication and that there is no real evidence of a threshold around 90%.
Since last week, people have been arguing about the importance of this particular paper, what the new results change and how much all this really matters. I have nothing to add about the economics but there is a small aspect of the whole kerfuffle that is particularly interesting if you care about interaction design and data analysis. I am thinking here about the blunder that Herndon uncovered in the Excel file provided by the original researchers. Now, this particular mistake was not the only or even the biggest one in the original analysis. Numerically speaking, it didn't even really matter at all but it did make the story a lot juicier. That the credibility of this particular result hinges more on this small detail than on the soundness of the analysis is disappointing but it seems difficult to imagine that the rebuttal would have made such a splash without the – somewhat undeserved – ridicule around the spreadsheet formula.
One thing that hasn't been much discussed is the precise nature of the problem. It's not really a “math error” (as it has often been described), it's not a questionable analysis decision (there were some of those as well but that's not what Reinhart and Rogoff are being mocked for) and it's not an Excel bug either. What happened is really a mishap in the interaction between the users (the researchers in this case) and their tool (Excel). They really meant to obtain an average of all their data but failed to notice that the software did in fact compute something else. To see how this happened, let's look at a screenshot circulating on the web:
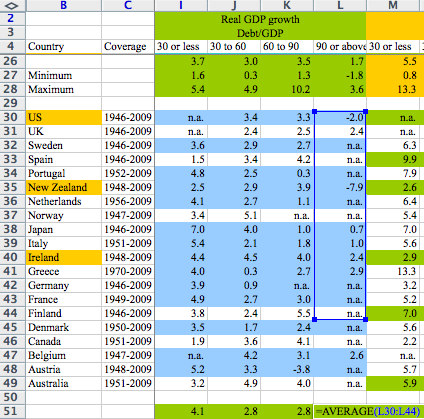
When the formula is highlighted, it's obvious that some cells are ignored. But since formulas are generally hidden and only the results are visible, the problem cannot be detected unless you click on the relevant cell. This weakness is compounded by Excel's selection and indexing mechanism. Unlike statistical software, spreadsheets do not expose “observations” or “variables” but an array of cells potentially mixing data, computation and results in a single worksheet. In fact, it seems that Excel's designers realized the potential for just this type of errors to occur because there is a built-in mechanism to warn users when a formula excludes neighboring data. However, this warning disappears as soon as the relevant range contains a mix of text and numerical values:

Of course, you can always argue that researchers have a duty to pay attention and double-check their computations but slips are common and unavoidable and a good user interface should help users avoid them or notice them in time. In fact, statistical software packages are designed to make such problems less likely by separating data, formulas and results and encouraging users to manipulate whole columns or variables rather than arbitrary cell ranges.
What makes this problem particularly thorny is that it really goes to the core of the interface. Short of turning Excel into SPSS, there is no obvious fix. Excel has changed a lot in its nearly three decades of existence but all these changes were either behind-the-scenes or “around” the main UI (including everybody's favorite UI disaster, Clippy, and Office 2007's ribbon UI). At the same time, its basic structure, with cells serving as input, computation units and output, remained untouched. All the competitors (Gnumeric, OpenOffice Calc) use the same basic model. It's very difficult to imagine a way to make spreadsheets more robust for data analysis without loosing a lot of their current flexibility (and existing user base).


No comments:
Post a Comment