Tuesday, May 7, 2013

Tips for data analysis with Excel

Last week, I commented on a prominent data analysis blunder in Excel. Even if this particular problem seems to result from the spreadsheet's design, anybody doing data analysis has experienced coding errors, no matter the tool. That doesn't mean that nothing can be done to reduce their occurrence. Phil Price shared some tips on avoiding data problems, mostly for R users. Here are some other tips with more emphasis on Excel:

  1. Make checklists. This might sound unimpressive but checklists have been used in aviation for decades and recent research suggests they have a great potential to improve safety in surgical procedures. If I am going to use some data pipeline repeatedly (perhaps because I am doing a pilot study or interim analysis or because I am going to analyze samples from several countries), I write down a list of the main steps in the analysis and then go through them one-by-one, checking them off as I go.
  2. Document everything. This is a general principle in software engineering and also the idea behind the tedious “method” sections in scientific publications but keeping track of what you did is very helpful when you want to do something similar or to diagnose an error some time after the initial analysis. Just like checklists, documentation doesn't need to be extraordinarily complicated. In Excel, I usually add a special worksheet named “Notes” containing a few sentences on the origin of the data and, when relevant, a code book for the main variables. It's not much trouble when creating the file, but it can literally save you hours of work if you ever need to come back to an old project after several months.
  3. Stick to the pipeline (using a checklist!). If I pulled some data from a database, merged it with some other data entered in Excel, exported everything to a statistical package and only then noticed a mistake, I won't correct it manually. Instead, I will create a corrected version of the original data file and update all intermediate steps. The idea is that having incoherent versions of a data set lying around make it more likely to copy some result from the wrong version or loose track of what I did.
  4. Use “version control”. For R or perl scripts, I use an actual version control system (subversion or git). I don't bother doing that for Excel workbooks (mostly because the “diff” function is not nearly as useful as with plain text files) but when I try a new analysis or add some data to an older one, I don't erase the original workbook, I create a new one (often with a name like XXXX-20130301). This helps keeping track of what I did or diagnosing problems down the line. If I extracted some result to put it in a report, I am able to find out where it came from even if I added data later on. Comparing versions also sometimes helps noticing or understanding problems (e.g. if some summary statistics do not change at all between versions, there might be some issues in the formulas).
  5. In Excel, keep the data in a separate worksheet and avoid touching them after the initial import. In particular, I avoid sorting records or recoding variables by search and replace. Instead, I create new columns or secondary worksheets. This makes formulas longer but ensures that I won't dissociate rows or accidently overwrite data. This also makes it easier to compare different Excel workbooks and the original data source if needed.
  6. When reusing a worksheet, start by “invalidating” it. What I mean by this is marking everything that needs to be updated. For example, when I want to analyze some new data following a procedure I used before, I first copy the workbook, color everything in red and then start updating cells, turning them back to their original color as I go. This technique can actually save you some time when you are in a hurry because you can then simply copy a workbook and focus on what you need right now. Since you are not working on the original file and the other worksheets are clearly marked as “invalid”, you don't need to worry about checking everything right away. Even if you can't update everything, you won't leave your workbook in an incoherent state and you will know where the new and where the old results are.
  7. Double-check everything. If there are several routes to get a result, code several of them and compare. For example, the sum of row totals, column totals and a grand total computed directly from the original table should all be identical, etc. This might sound like a waste of time but when you find embarrassing mistakes after working on a data set for days, you realize how easily stupid mistake can slip through. For results that will end up in a publication, I strive to run the main analysis from the ground up in two different statistical packages (e.g. R and SPSS) when possible. The goal is not so much to check for bugs in the packages themselves but to expose coding or scripting errors on my part. Obviously, this can be very time-intensive, not so much because of the analyses themselves (if you decided what you want to do and know how to do it, it can be very fast) but because you will invariably run into puzzling differences that take a long time to understand (rounding errors, hidden defaults, slightly different formulas for what you thought were identical tests, etc.) You do learn a lot about your tools in the process, though.
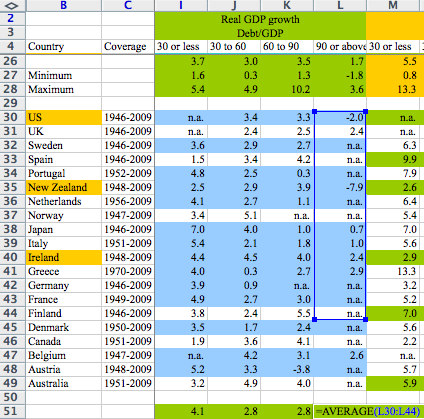
  8. Use tables (also known as lists). I don't use them very often, but I though I should mention tables anyway because they directly address the issue in the Reinhart-Rogoff Excel worksheet. In a table, variables can be manipulated as such, just like in a regular statistical package, providing something close to the “data frame” construct in R.

Thursday, April 25, 2013

Reinhart and Rogoff's Excel blunder and human-computer interaction

If you follow any stats blog, you have probably heard of Reinhart and Rogoff's paper “Growth in a Time of Debt” by now. If you missed it, it's a paper arguing that public sector debt levels over 90% are associated with much lower growth. It was published three years ago but it has been much talked about since Thomas Herndon, Michael Ash and Robert Pollin released another paper showing that the association is much weaker than suggested in the original publication and that there is no real evidence of a threshold around 90%.

Since last week, people have been arguing about the importance of this particular paper, what the new results change and how much all this really matters. I have nothing to add about the economics but there is a small aspect of the whole kerfuffle that is particularly interesting if you care about interaction design and data analysis. I am thinking here about the blunder that Herndon uncovered in the Excel file provided by the original researchers. Now, this particular mistake was not the only or even the biggest one in the original analysis. Numerically speaking, it didn't even really matter at all but it did make the story a lot juicier. That the credibility of this particular result hinges more on this small detail than on the soundness of the analysis is disappointing but it seems difficult to imagine that the rebuttal would have made such a splash without the – somewhat undeserved – ridicule around the spreadsheet formula.

One thing that hasn't been much discussed is the precise nature of the problem. It's not really a “math error” (as it has often been described), it's not a questionable analysis decision (there were some of those as well but that's not what Reinhart and Rogoff are being mocked for) and it's not an Excel bug either. What happened is really a mishap in the interaction between the users (the researchers in this case) and their tool (Excel). They really meant to obtain an average of all their data but failed to notice that the software did in fact compute something else. To see how this happened, let's look at a screenshot circulating on the web:

When the formula is highlighted, it's obvious that some cells are ignored. But since formulas are generally hidden and only the results are visible, the problem cannot be detected unless you click on the relevant cell. This weakness is compounded by Excel's selection and indexing mechanism. Unlike statistical software, spreadsheets do not expose “observations” or “variables” but an array of cells potentially mixing data, computation and results in a single worksheet. In fact, it seems that Excel's designers realized the potential for just this type of errors to occur because there is a built-in mechanism to warn users when a formula excludes neighboring data. However, this warning disappears as soon as the relevant range contains a mix of text and numerical values:

Of course, you can always argue that researchers have a duty to pay attention and double-check their computations but slips are common and unavoidable and a good user interface should help users avoid them or notice them in time. In fact, statistical software packages are designed to make such problems less likely by separating data, formulas and results and encouraging users to manipulate whole columns or variables rather than arbitrary cell ranges.

What makes this problem particularly thorny is that it really goes to the core of the interface. Short of turning Excel into SPSS, there is no obvious fix. Excel has changed a lot in its nearly three decades of existence but all these changes were either behind-the-scenes or “around” the main UI (including everybody's favorite UI disaster, Clippy, and Office 2007's ribbon UI). At the same time, its basic structure, with cells serving as input, computation units and output, remained untouched. All the competitors (Gnumeric, OpenOffice Calc) use the same basic model. It's very difficult to imagine a way to make spreadsheets more robust for data analysis without loosing a lot of their current flexibility (and existing user base).

Thursday, January 31, 2013

Neuromarketing: What lies beyond the hype?

Neuromarketing is once again making some (discrete) headlines. This time, it's a study purporting to show that eating chocolate is more pleasurable than many things (but less than finding money). The problems with such studies have already been discussed at length elsewhere but there is a small detail that is often overlooked: Even if you take all the claims at face value and forget for a minute that it's absurd to inform people about what they really enjoy (and, believe my scientific opinion, you are having a lot of fun right now even if you don't actually feel it), these studies always compare widely different activities (one of which is usually eating chocolate, for some reason).

The question is: How is that interesting to anybody? It won't tell you if that chocolate is better than any other and it certainly won't help you create a better or more successful chocolate. You might try to generate some hype around the notion that redecorating a room is more exciting than sex but I don't recall ever having to choose between them in my life and that won't really be useful to anybody selling anything else than paint. Once we have created a canonical list of pleasures and we all agree that redecorating and eating chocolate are really really fun, there is not much you can do about it apart from giving up your current business and start making wallpaper and chocolate (or, apparently, spreading money randomly on the streets but it's unclear how that could be profitable).

Interestingly, that's not entirely coincidental. In more rigorous neuroscience or psychophysiological research, the protocol usually involves showing a large number of pictures to a bunch of people only to find a small (but significant, hallelujah!) effect. And the pictures I am talking about are not different shades of paint or different chocolate bars, it's usually some pretty strong stuff like badly burned people and car accidents. What many people fail to realize is that physiological measures, while they can be fascinating, are usually extremely noisy and often require tedious repetitions and large(ish) samples to merely find any difference in the way people respond to anything. If we ever get beyond the hype, solve the huge inference problems and start conducting proper neuromarketing studies, there is still a long way to go from coarse differences between activities to useful comparisons between products in the same category or different versions of the same ad.